Microsoft Research Introduces Flint-Interactive for AI-Generated Data Visualizations
· GlobeWire Daily Editorial Desk · Source: www.microsoft.com
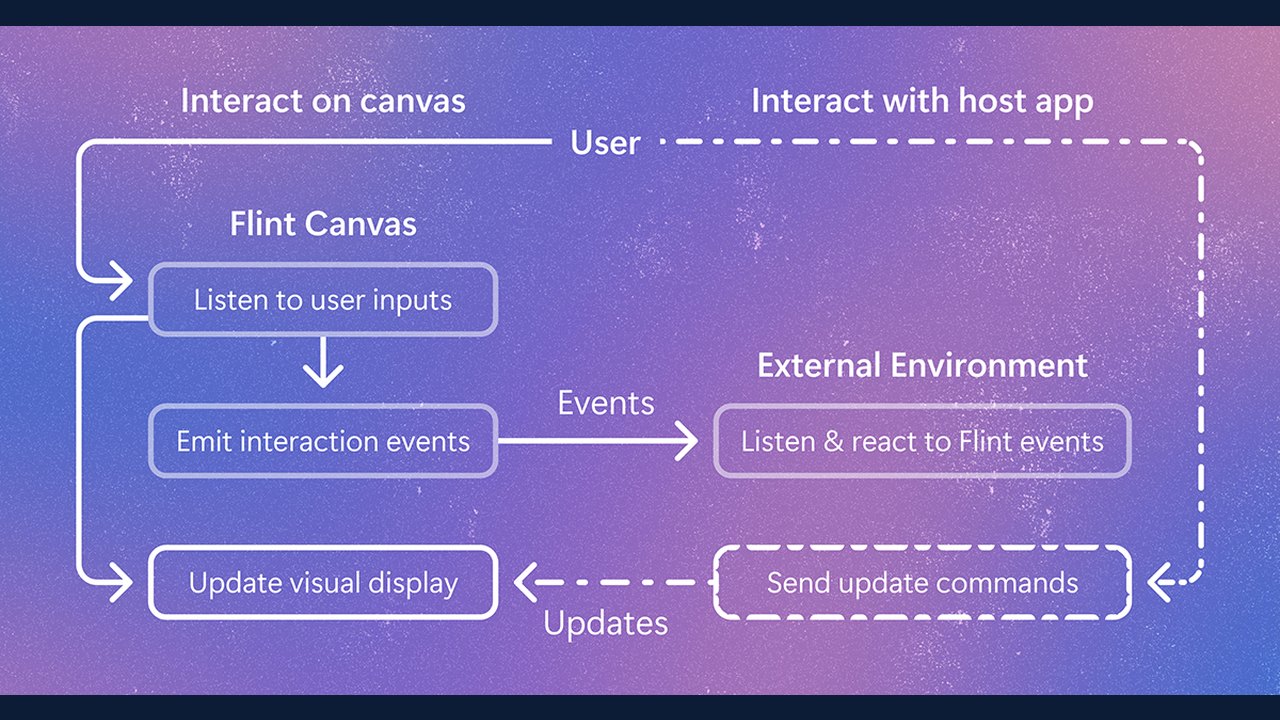
Image: Brenda Potts · Photo source · Resized and letterboxed to 16:9; no AI generation
Microsoft Research has discussed Flint-interactive, a newly described language designed to help AI agents and users create interactive data visualizations. According to the announcement, the system aims to bridge the gap between static AI-generated charts and dynamic data exploration by enabling features such as clicking, filtering, zooming, highlighting, and cross-chart connections.
Addressing Challenges in AI Visualization
Generating custom interactive charts through AI models often involves high token costs, iterative debugging, and layout reliability issues. Flint-interactive aims to reduce this development effort by utilizing a compiler to handle interaction logic and visual dependencies. Key reported aspects include:
- High-Level Semantic Events: Instead of writing low-level code, users and agents define behaviors using semantic events and update operators.
- Cross-Component Connectivity: Supports interactive data stories, dashboards, and connected experiences where actions in one view update charts, documents, or application states.
- Separation of Concerns: The system separates visual logic managed by the compiler from user-specified interaction logic.
Practical Implementation Options
According to the details provided, users and developers can integrate the system through several methods:
- Chat and Canvas Environments: Use Flint Interactive directly in chat or canvas environments through Flint-MCP and MCP Apps by following the setup guide.
- Application Building: Build interactive dashboards and data stories using Flint Interactive Canvas and its programming API to define custom event handlers and update operators.
- Community Contribution: Interaction designers can explore examples, design new presets, and propose them on GitHub.
Readers interested in verifying these details or exploring technical documentation can review the original Microsoft Research blog post and associated setup guides.
AI-assisted reporting; source claims are attributed and have not been independently verified.
More to read
 Suno Introduces AI-Generated Visuals and Video Feature for Songs
 Google Gemini Notebook adds feature to turn research into interactive websites
 Aviemore Introduces Seal-Less Magnetic Coupling Pump Platform for Liquid-Cooled AI Data Centers
 ZTE Introduces Power and Cooling Infrastructure for High-Efficiency AI Data Centers